Design Process
Inspiration
This project initially aimed to explore global renewable energy production. However, due to the complexity of cleaning and organizing related datasets, I shifted focus to world population data. Population numbers are straightforward, mathematically manageable, and globally available, making them an ideal subject to gain proficiency with D3.js. This dataset serves as a foundation for future analyses of renewable energy and emissions trends.
Initial Designs and Sketches
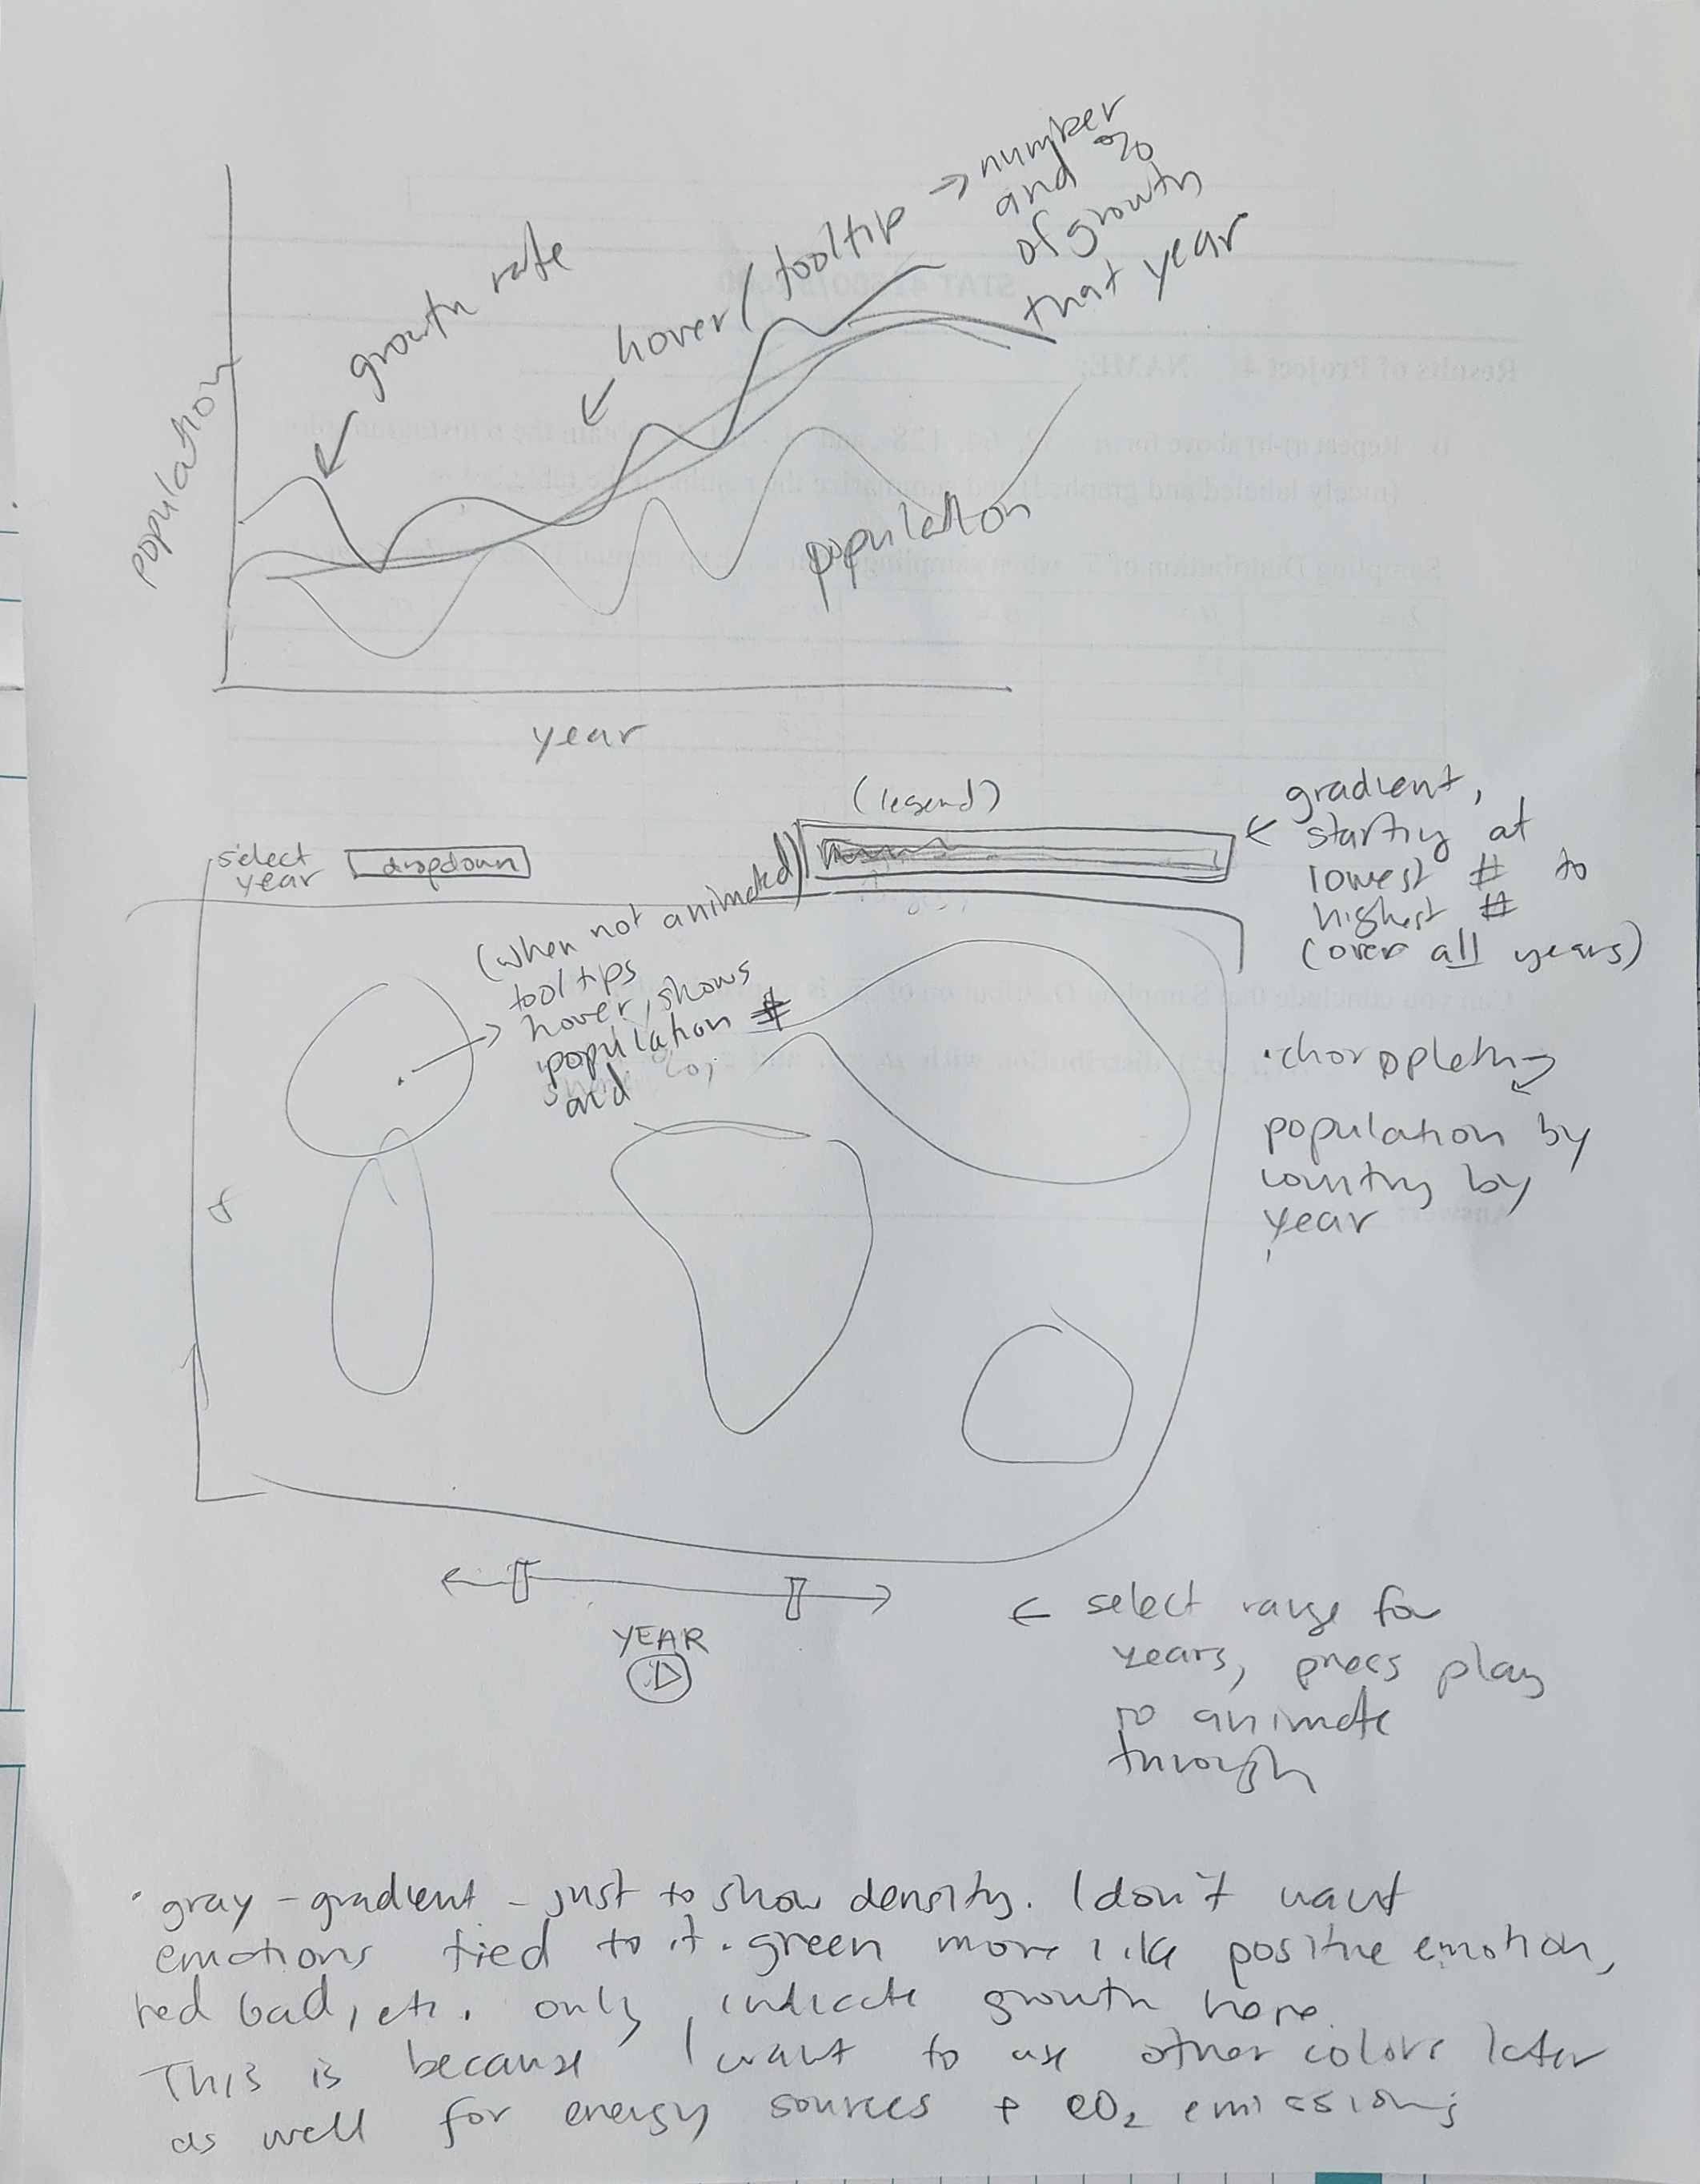
Early in the design process, I created numerous rough sketches to explore ideas and determine how best to visualize the data. These sketches helped shape the final designs by allowing me to experiment with layout, interactivity, and aesthetic choices. Below are two examples of these drafts:
These sketches served as a blueprint for the project and provided clarity as I transitioned to coding and refining the visualizations in D3.js.
Rationale for Design Choices
Visual Types
- Choropleth World Map: A natural choice for geographic data. It highlights population density and growth visually by country, helping users identify significant trends geographically.
- Area Chart: The area chart was chosen to best show changes in population numbers over time - filled to give a sense of weight and density. Additionally, I wanted the filled part to contrast with the second line indicating the growth rate. This line also shows changes over time, and have a separate y-axis.
Color Palette
The choropleth initially used a grayscale gradient, but subtle changes were difficult to discern. Bins with more divergent colors were introduced to make changes more noticeable, especially during animation. The colors for these bins were chosen to not evoke positive or negative emotion, so I avoided colors like red or yellow that might signal alarm. The area chart retained a neutral palette for simplicity and focus on trends. The gray-blue rate line was chosen for visibility, neutrality, and coordination with the choropleth map.
Interactive Elements
- Choropleth Map: Features a year dropdown and a slider for smooth animation, enabling users to observe changes dynamically. Tooltips provide additional details for each country- some of which came directly from the data and others needed to be calculated using js.
- Area Chart: Includes tooltips for specific values and a hover line for precise year identification.
Layout
The choropleth map's feature placement went through a long process of trial and error. Though I initially planned to have the lengend at the top right, I later found that to be a better placement to display the current year. Placing the legend at the bottom allowed it to still be immediately visible. I chose to anchor all of the map components so that they remain in the same place while the map is being manipulated- this way the user can't lose sight of what year they're in.
Insights and Findings
Initial Questions To Guide The Project
- What areas in the world have the densest population?
- How is population growth changing over time? By country, and globally?
- Is the population growth rate decreasing overall, or just in some regions?
- What might the future world population look like, given current rates and trends?
Key Observations
- Population Density: The choropleth reveals that regions like India and China dominate population density and growth. Surprisingly, most areas remain stable or experience minimal changes, comparatively.
- Growth Rate Trends: The area chart shows a steady decline in global growth rates, even as total population continues to rise due to compounding effects.
- Historical Events: A sharp drop in growth between 1958 and 1960 corresponds to global events like famine in China, where we can clearly see the sharp increase in rate and population due to the 1960's "baby boom".
Conclusions
Despite declining growth rates, population numbers are rising at alarming rates. Managing these increases will require addressing resource demands and environmental impacts. The visualizations provide a foundation for further analysis into related issues, such as emissions and renewable energy needs.